
Attacks on Ukrainian public institutions do not respect office hours. Most organizations, however, cannot staff a security operations center around the clock: it takes analysts on three shifts, a detection platform, threat intelligence and incident-response playbooks — and it has to work next month, not in two years.
A managed SOC delivers that capability as a service. Below is the reference architecture we deploy on Security Onion, an open detection and threat-hunting platform, with all events and logs kept in a KSZI-certified cloud in Ukraine.
Why public-sector teams buy SOC as a service
- 24/7 coverage without hiring nine people. Three shifts of L1, L2 and L3 analysts are shared across customers, so you pay only for your share.
- Time to value. Monitoring starts in about 40 days instead of a multi-year SIEM programme.
- Regulatory fit. Logs stay in Ukraine, access is controlled and incidents are reported to CERT-UA within the agreed timeframes.
- Predictable budget. A price per monitored server and workstation plus platform resources — no surprise license renewals.
Reference architecture
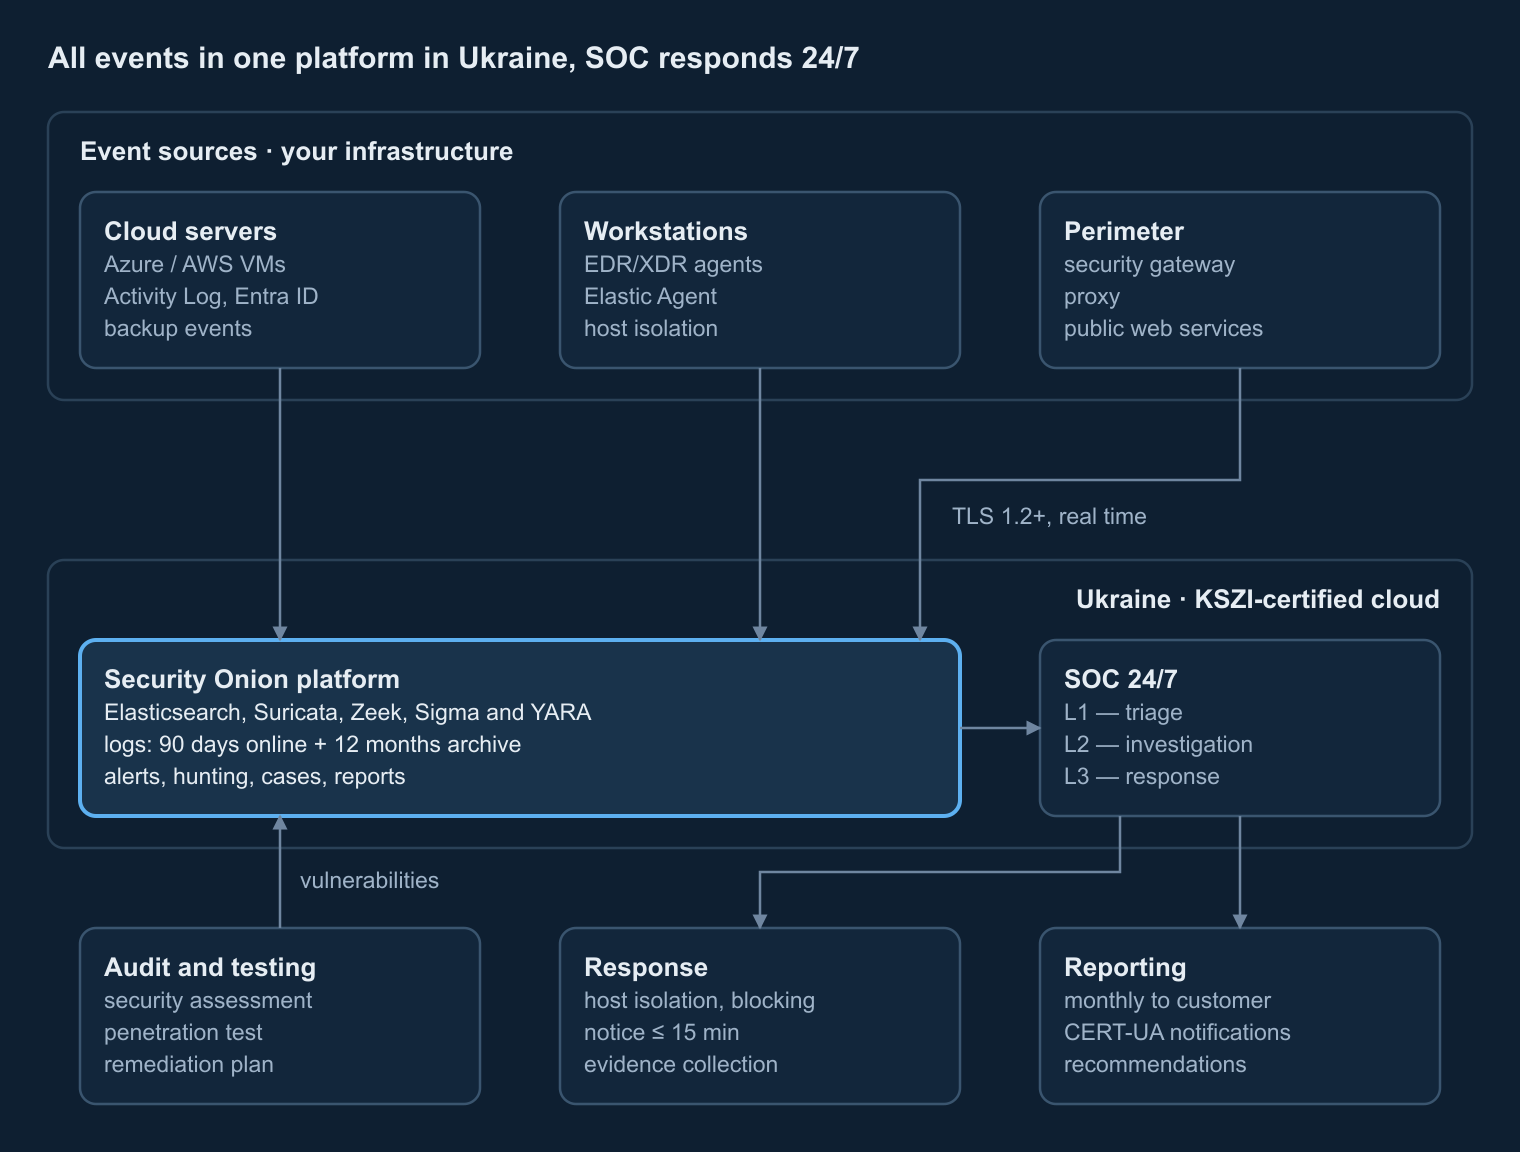
Event sources include cloud servers — for example Azure VMs with their Activity Log, Microsoft Entra ID sign-ins and backup events — workstations with EDR/XDR agents, and the network perimeter: security gateway, proxy and public web services. Events travel over TLS to the Security Onion platform in Ukraine, where they are normalized, correlated and stored: 90 days online and 12 months in the archive.
Analysts work in the Security Onion console: L1 triages alerts, L2 investigates, L3 contains incidents and hunts for threats. Response actions — isolating a host through EDR or blocking an address on the gateway — follow a playbook agreed with you in advance.
Why Security Onion
Security Onion is a free and open platform built by defenders for defenders. Version 2.4 combines network and host visibility, log management and case management in one stack:
- Elasticsearch stores and searches all events.
- Elastic Agent collects host data from servers and workstations, with live queries through osquery and central management in Elastic Fleet; devices without agents send Syslog.
- Suricata and Zeek provide signature-based network detection, protocol metadata and file extraction; Strelka analyses the extracted files.
- Sigma, YARA and Suricata rules drive detections and are tuned in the Detections module.
- Security Onion Console brings alerts, dashboards, hunting, cases and packet capture together, with CyberChef for artefact analysis.
Because the platform is open, there are no SIEM license fees: the budget goes into analysts, detection engineering and infrastructure instead of per-gigabyte licenses.
Detection engineering mapped to MITRE ATT&CK
Out-of-the-box rules are a starting point, not a detection strategy. During onboarding we baseline normal activity for 10–15 days, tune noisy rules and add detections for the techniques most often used against public bodies: credential theft, abuse of remote-access tools, living-off-the-land binaries, data staging and exfiltration.
Every rule is mapped to MITRE ATT&CK, so coverage gaps are visible. A quarterly review shows which tactics are covered, which rules fired and what was tuned.
Response playbooks and SLA
Response times are measured from the moment an alert appears in the platform:
| Priority | Example | Notification | Response starts |
|---|---|---|---|
| Critical | ransomware, compromised admin account, data leak | 15 min | 30 min |
| High | suspicious server activity, password spraying | 1 h | 2 h |
| Medium | policy violations, newly found vulnerabilities | 4 h | 1 business day |
| Low | informational events | monthly report | — |
Monthly reports cover incidents and actions taken, event statistics, agent health, vulnerabilities and recommendations; once a quarter we review the security posture together. Incident notifications to CERT-UA are prepared and sent in agreement with you.
Logs stay in Ukraine: compliance and access control
- Hosting. The platform runs in a KSZI-certified cloud of a provider on the SSSCIP list — for example De Novo, GigaCloud, DataPark or UCloud.
- Encryption. TLS 1.2+ in transit and AES-256 at rest.
- Access. Isolated analyst accounts with MFA and full audit logging; SOC identities are not federated with your Microsoft Entra ID.
- Least privilege. Read-only roles in the cloud (Reader, Security Reader); response actions only under the agreed playbook.
- Confidentiality. A non-disclosure agreement, and no transfer of your data to third parties.
40-day onboarding plan
- Days 0–10. Platform deployment in the KSZI-certified cloud, access and secure event channels.
- Days 10–25. Agents on servers and workstations; connectors for cloud logs, identity, gateway and proxy.
- Days 25–40. Baselining, tuning and launch of 24/7 monitoring.
- First quarter. Security assessment and vulnerability scan with a remediation plan.
- Third quarter. External penetration test and re-test of the fixes.
How a managed SOC is priced
A transparent SOC price has four parts, each of which you can verify:
- Monitoring per object per month — a server or a cloud or network source costs more than a workstation because it produces more events and needs more analyst attention.
- Platform resources — vCPU, RAM and log storage in the KSZI-certified cloud, sized for your event rate.
- One-time onboarding — deployment, source onboarding and tuning, plus the security assessment and the penetration test.
- EDR/XDR licenses per endpoint, if you do not already have a suitable solution.
Pair the SOC with an immutable backup reserve in Ukraine and you cover both detection and recovery: the SOC watches backup jobs and alerts on any attempt to tamper with them.
Request a SOC readiness assessment
Tell us what you need to monitor — we will propose the architecture, event-rate sizing and a 40-day onboarding plan.
This guide was prepared by Corvus Intelligence engineers who design backup, disaster recovery and security monitoring for government and critical-infrastructure organizations. About Corvus Intelligence →